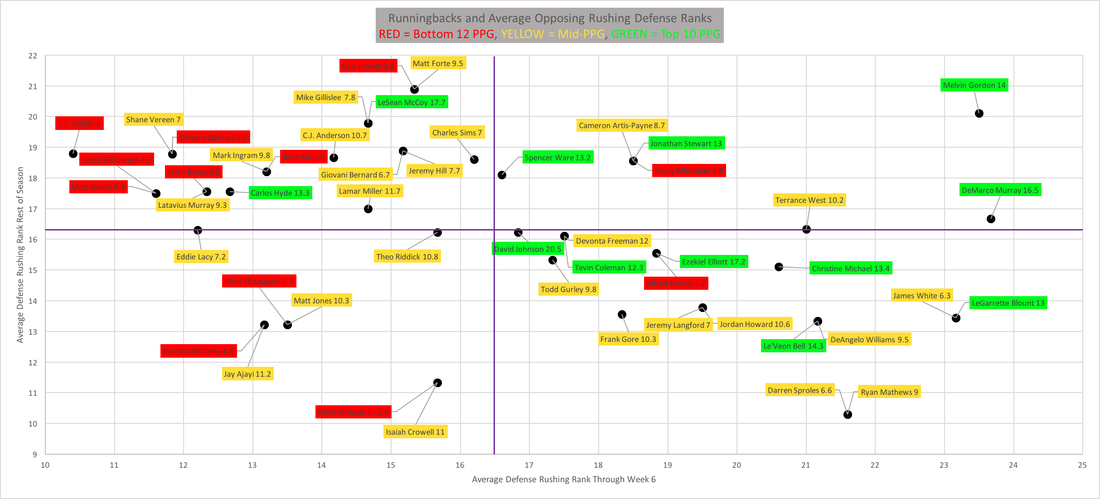
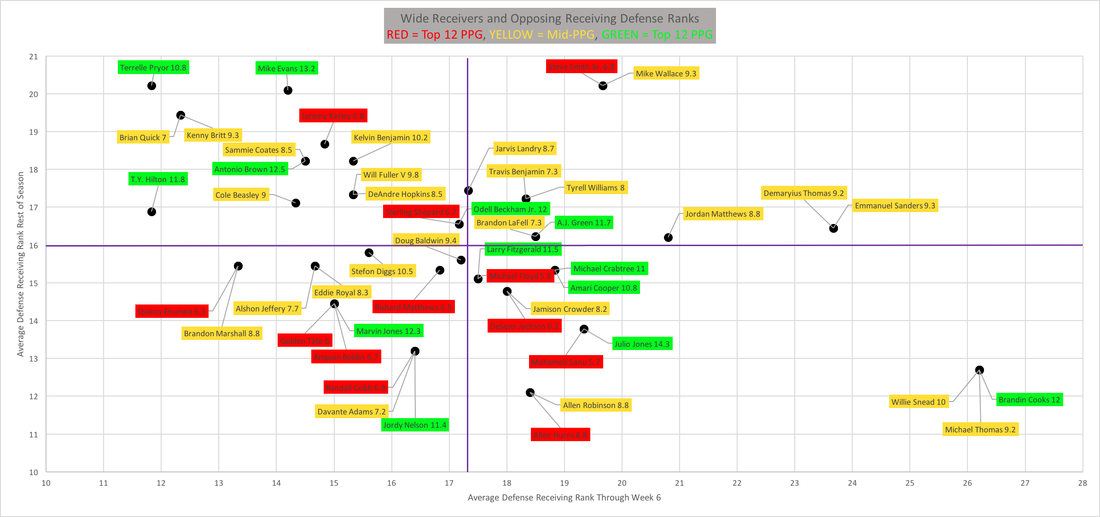
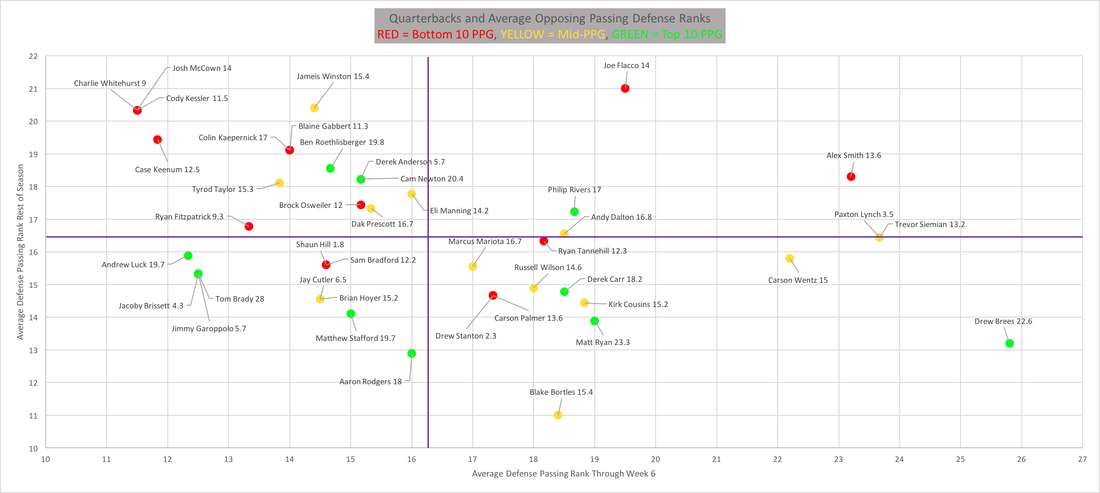
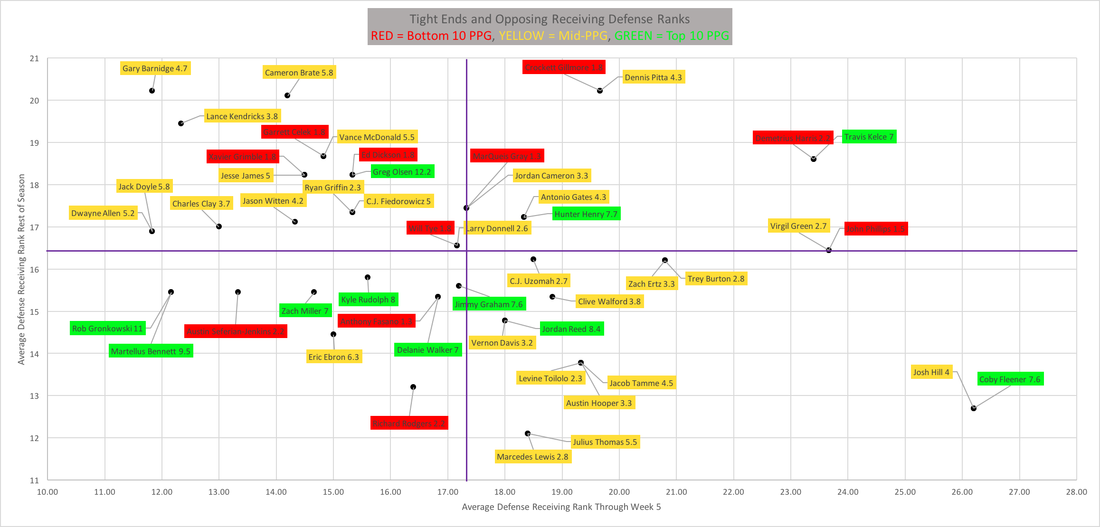
The following graphs show the average rank of passing, rushing, and receiving defenses through the first 6 weeks on the horizontal (x) axis and the average rank of passing, rushing, and receiving defenses for the rest of the season on the vertical (y) axis. The top 50 players at each position were pulled from ESPN standard scoring. Each player is represented by a point on the plot.
- If the player has a red dot it means they were in the bottom 10-12 points per game at that position.
- A green dot signifies they were in the top 10-12 points per game at that position.
- Players with yellow dots represent players in the middle.
- The vertical purple line indicates the average rank of the opposing defenses for that position thus far.
- The horizontal purple line indicates the average rank of the opposing defenses for that position for the rest of the season.
- Players to the right of the purple line have had relatively easier schedules thus far.
- Players above the purple line will have relatively easier schedules moving forward.